Getting Started
In NEXTMOL Modeling, the work is organized in projects.
A project can contain several experiments.
An experiment consists of a workflow and various jobs or computations. The workflow is a sequence of steps (or nodes) that start with the molecules, build the system, and calculate its physico-chemical properties.
The execution of the experiment’s workflow is a job. One can run different jobs ending in different nodes or with different parameters. Once the execution has finished, one can analyze the results.
Create a project
-
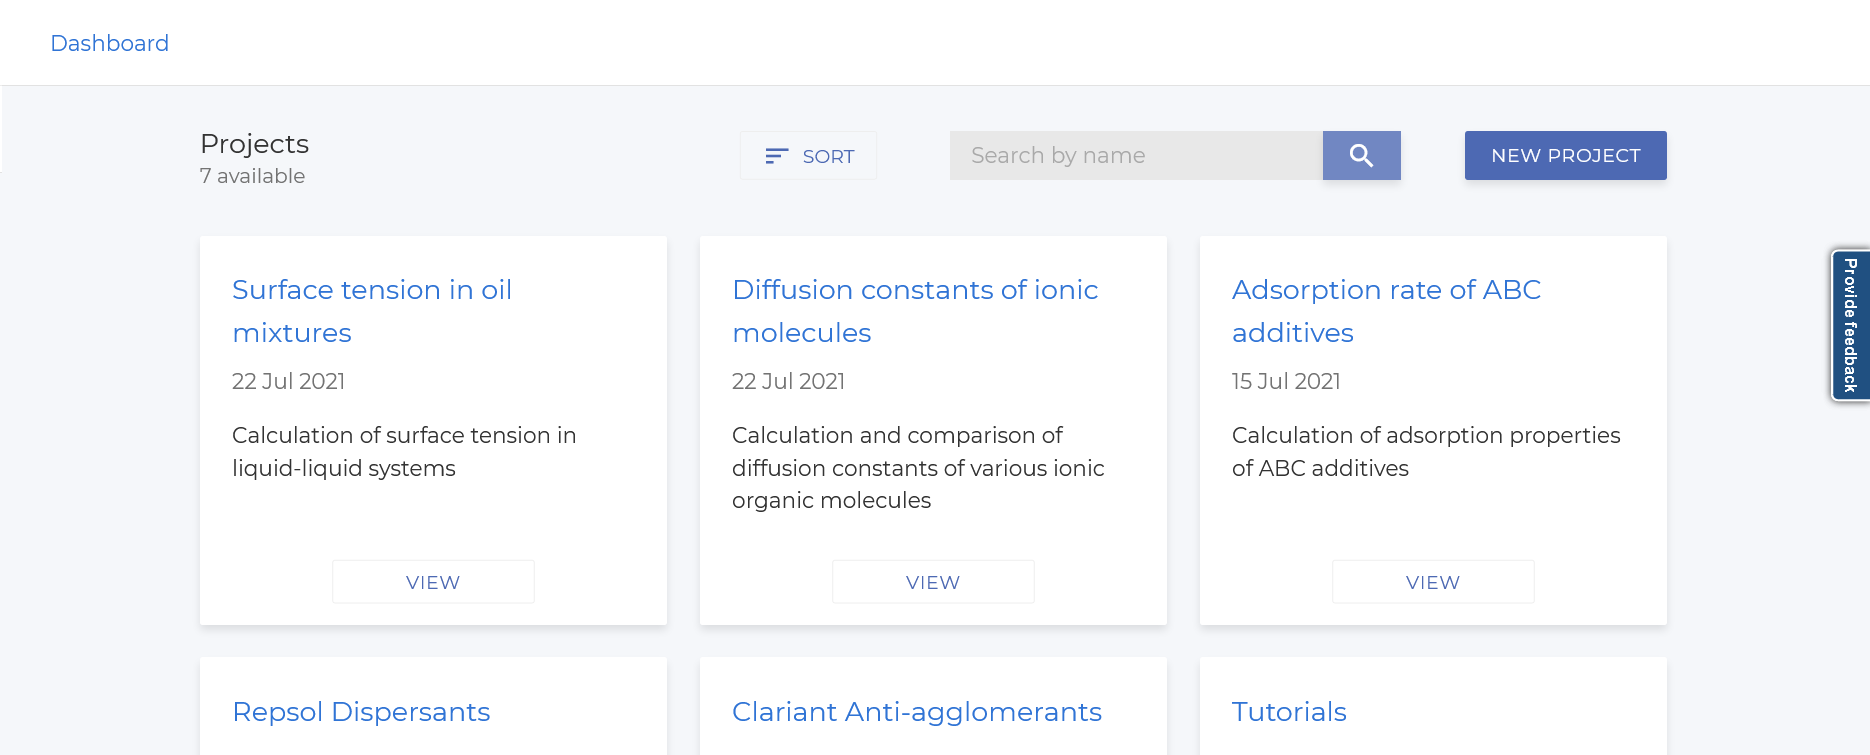
Go to Dashboard > My recent projects >
 > New project, or
 -
Go to the left navigation bar > Projects and press the NEW PROJECT button. Introduce the project name in the Info tab, and click the Save button. Once the project is saved, the Experiments and Jobs tabs will become active.

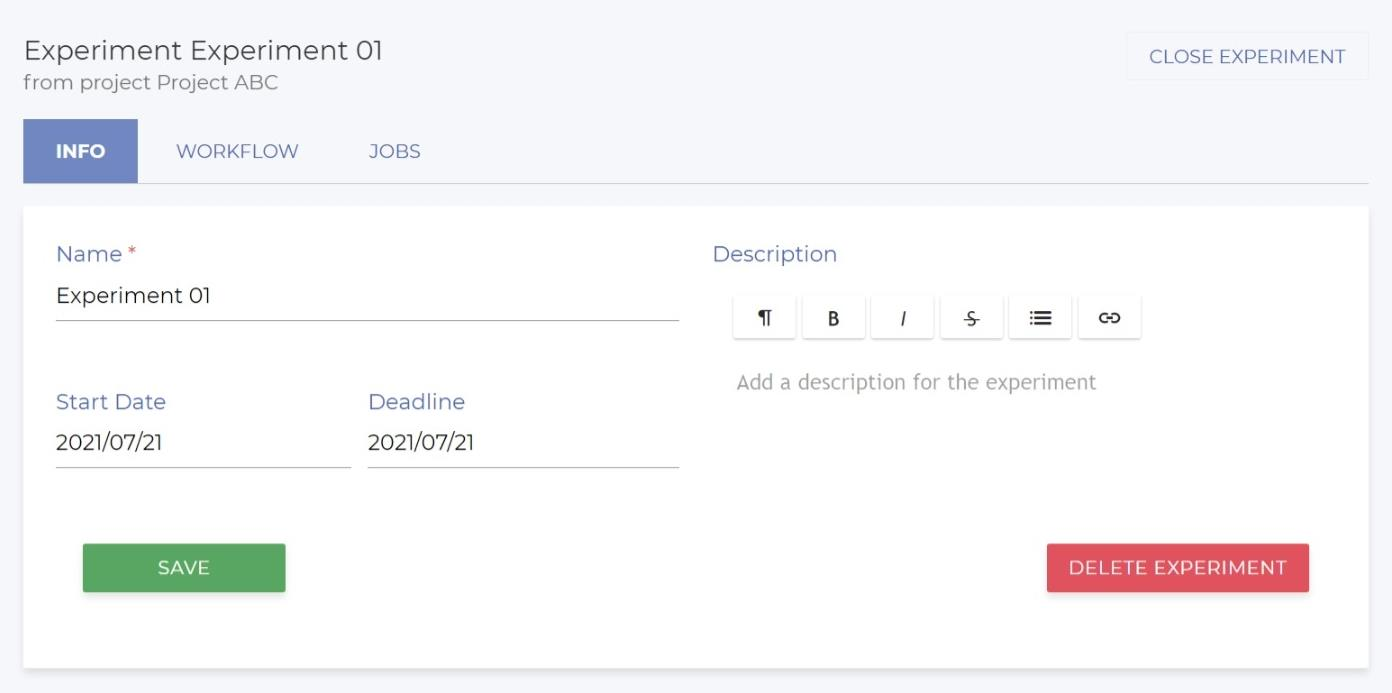
Create an experiment
Go to the Experiments tab of the project, and create an experiment by clicking the NEW EXPERIMENT button. Introduce the experiment name, and save the experiment to proceed. Then, the Workflow and Jobs tabs will become active.
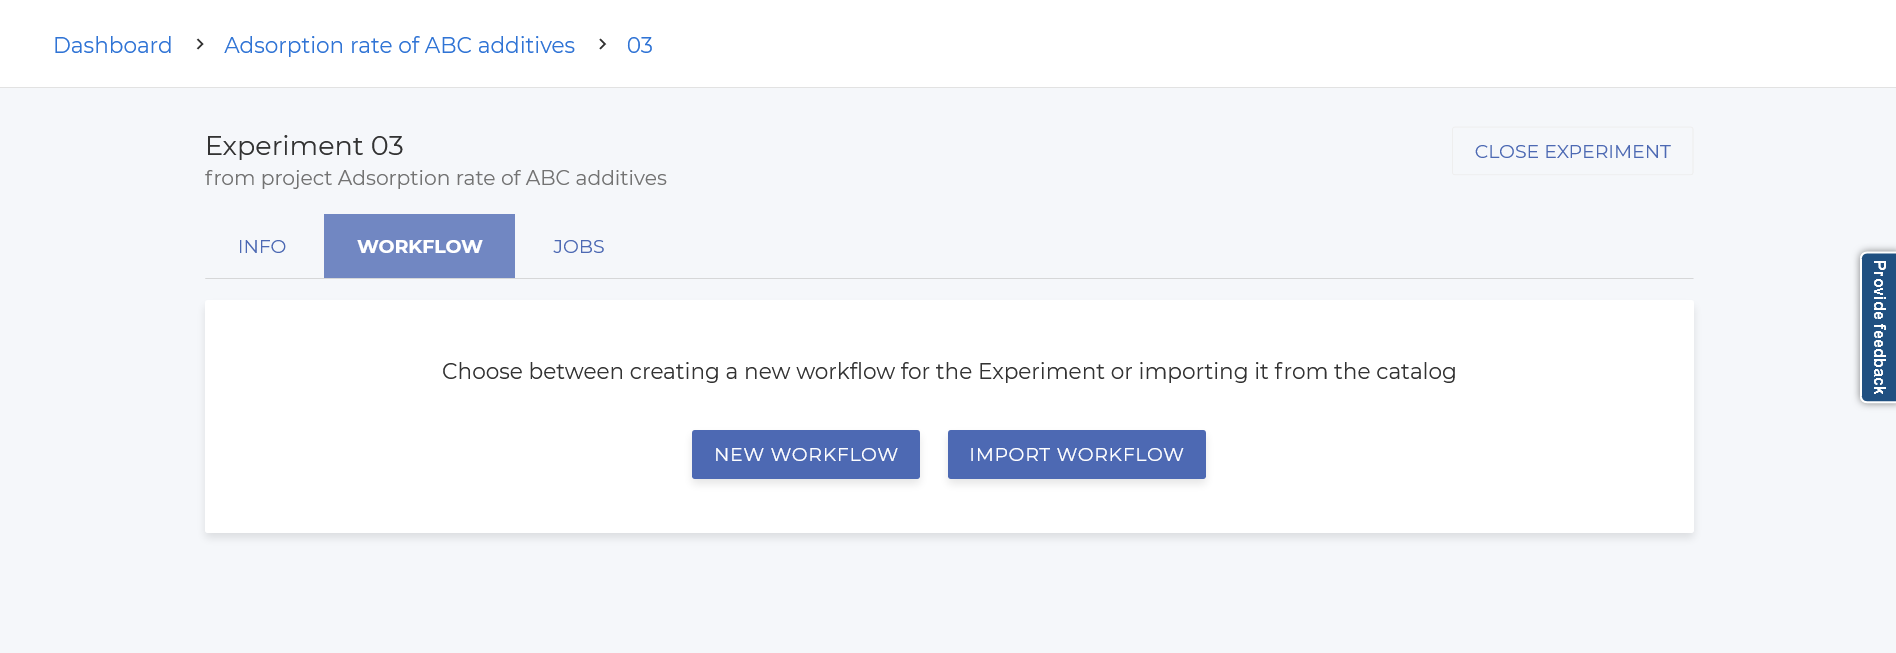
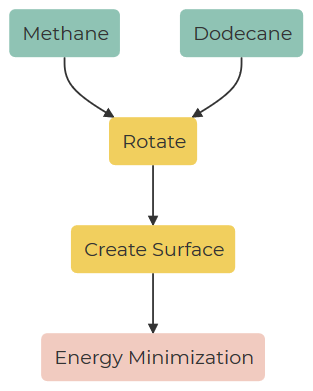
Create a workflow
Go to the Workflow tab of the experiment. Now you can choose between creating a new workflow or importing an existing one. The importing option opens the workflow catalog that allows to select an already created workflow. The creation of a new workflow allows introducing the name of the workflow and then opens a working space where various operation can be performed:
-
Adding molecules to the workflow. The available molecules are the ones that are present in the molecule catalog. New molecules can be created from the catalog. Each molecule has an associated potential that must be selected when the molecule is added.
-
Adding steps to the workflows. Three type of steps can be introduced: system operations (for building the system) simulations (for a Molecular Dynamics simulation) and analysis (for a postprocessing calculation). Each step require the selection of the parent nodes and the parameters for the step.
New workflows can be exported to the workflow catalog using the button ADD TO CATALOG
Create and execute a job
Go to the workflow and select the final step of the calculation. All the previous steps will be calculated. Click on CREATE JOB. Introduce the name of the job and save it. In the Execution tab you will find all the steps to calculate. Click on EXECUTE JOB to launch the calculation.
The jobs/nodes can have the following states:
|
The job/node has not yet been submitted to the server. |
|
The job/node is being processed by the platform. |
|
The job/node is waiting for resources, either computational resources or a parent node to finish. |
|
The job/node is being executed. |
|
The node execution has finished and the results are being processed and saved. |
|
The job/node has finished and the results are available. |
|
The job/node has been canceled by the user. |
|
The job has stopped because it reached the maximum time of calculation. Accumulated progress can be used re-executing the job. |
|
The execution of the job/node has failed and the log files are available. |
|
The execution of the job/node stopped unexpectedly. Please contact support at support@nextmol.com. |


When you want to create a new job, you also have the option to reuse completed nodes of a previously calculated job. To do so, in the first page that appears when you create a new job, select the option Reuse completed nodes from job. All the nodes that are in common between the new job and the one to be reused, will be automatically set as completed, unless the corresponding node in the workflow has been modified in the meanwhile.
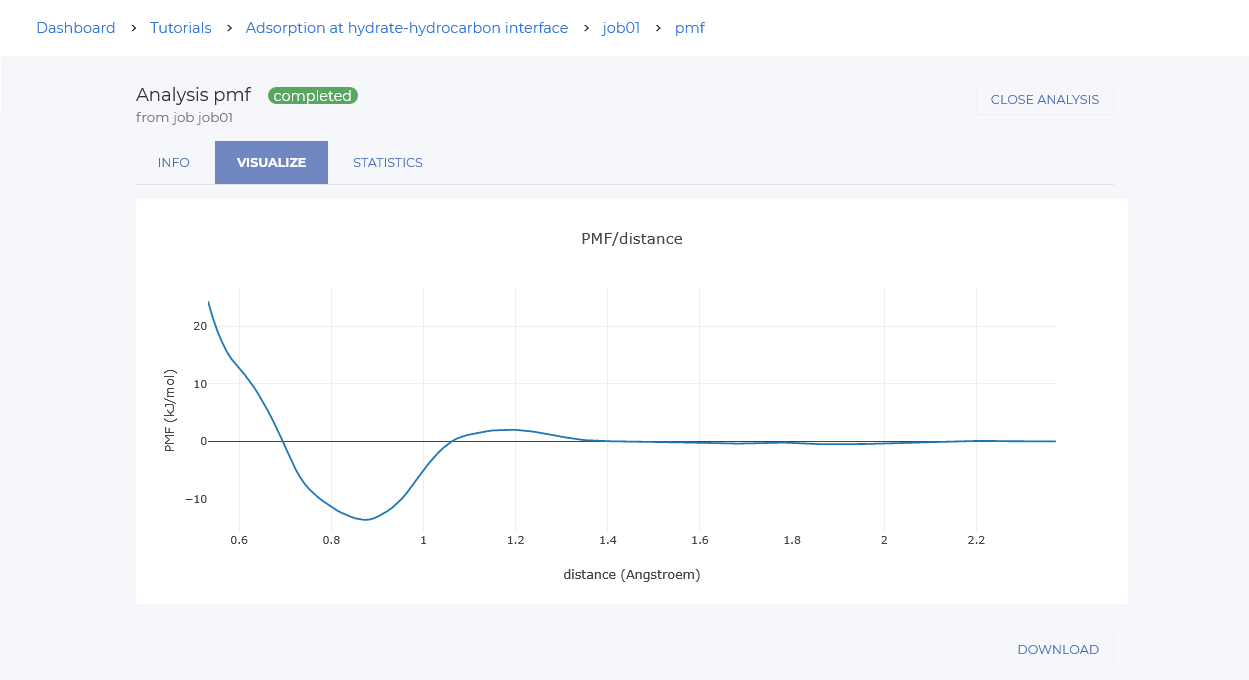
Analyze the results
Once the calculation is completed, go to the Graph tab of the job, select the step you would like to analyze and
click on NEW ANALYSIS button. You can choose between:
-
2D analysis: visualization of the results in an interactive 2D graph.
-
3D analysis: visualization of the results in an interactive 3D visualizer.
-
2D heat map analysis: visualization of the results in an interactive 2D map.
-
3D heat map analysis: visualization of the results in an interactive 3D visualizer, with a color code for the 3D points.
The Data analysis allows you to select the quantity(-ies) to analyze. The Data that are produced by simulations and post-processes are scalars, matrices or arrays. In case they are arrays, it is possible to select one quantity for the x-axis and one for the y-axis and plot the results. The data can be downloaded in a .json format.